Beyond Timeouts: Detecting System-Wide Latency Shifts
Introduction
I was going through an insightful blog about how Gradient Labs built their customer-facing agentic system. One part that particularly caught my attention was their failover mechanism.
Here, when a single request takes more than a threshold time, it triggers the failover mechanism, which allows them to switch their LLM provider or model depending on the severity of the request timeout.
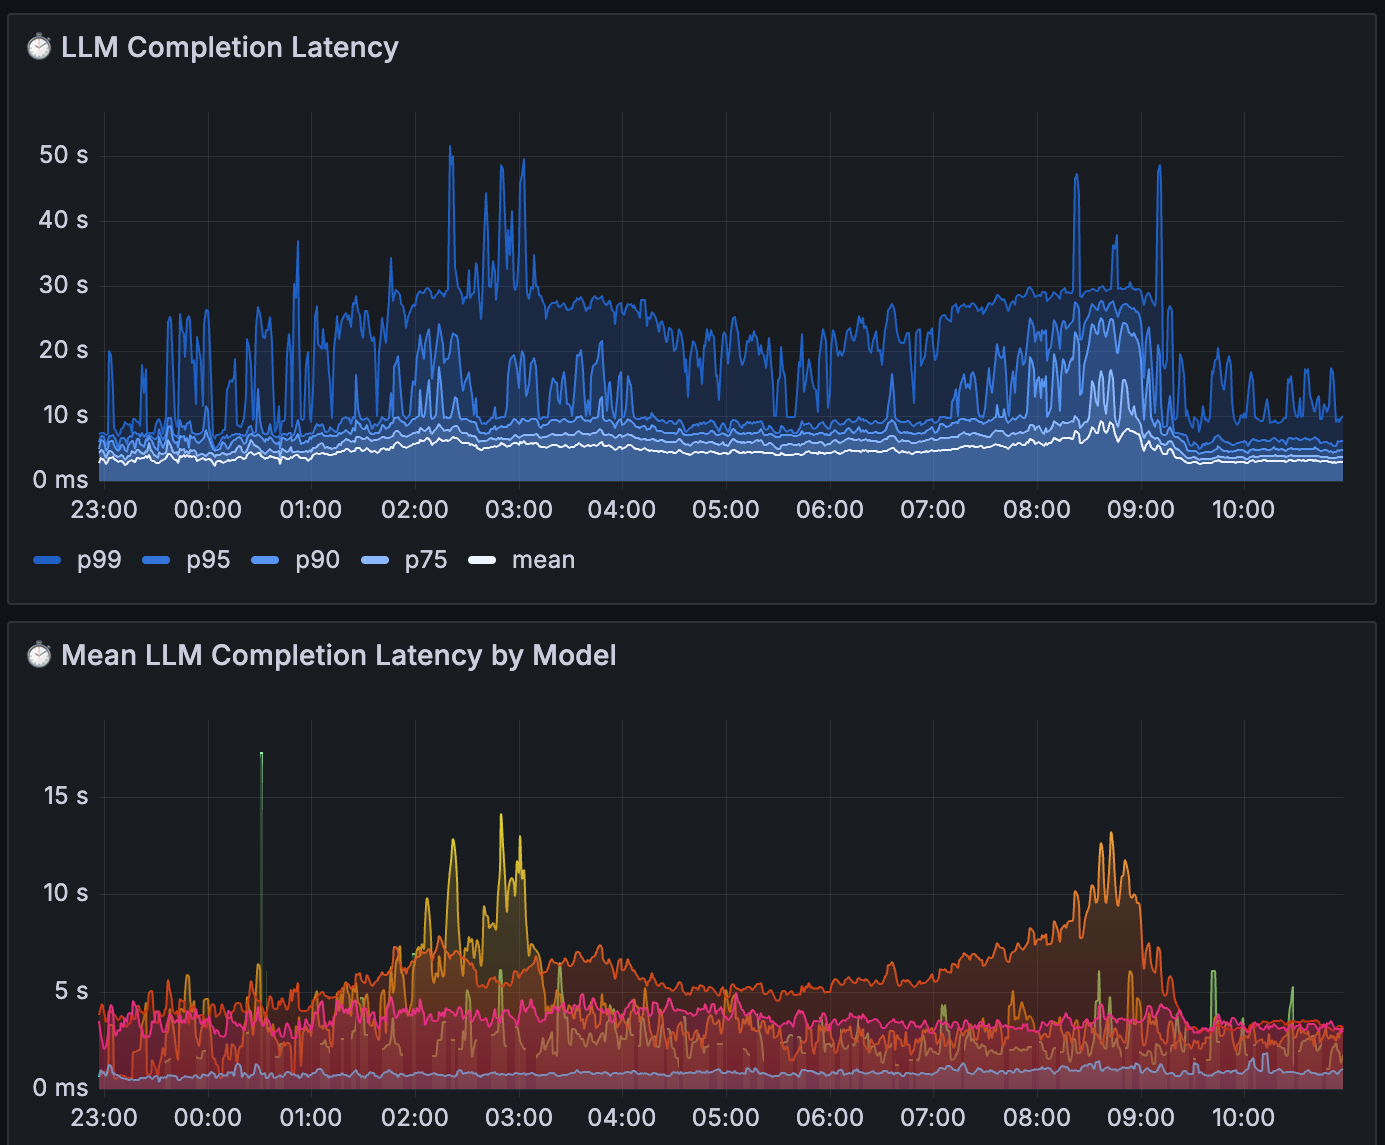
However, in the example they shared, between 8:00 and 9:00, the mean latency and p75 latency (75th percentile) showed an increase. The entire system became slower. But because the tail latency (p99) did not cross the failover threshold, the failover mechanism did not activate. As a result, they had to switch providers manually.
Why?
Because when the mean or p75 latency increases, it indicates a global slowdown. Responses are slower overall, and this impacts user experience.
Hence, I thought that I could use some of the methods I know to provide a solution. And here we are!!
Classical Methods
Fixed Threshold
if p75_latency > baseline_p75 × 2:
    Trigger failover.
Instead of looking only at the tail latency, i.e, the p99 or the exceptionally slow requests, we can look at the middle of the latency distribution too. Why? Because lower percentiles contain the global context, which we can simply compare to a threshold, and we will get a fundamental check for slow networks
Recent history
if p75_latency > Average p75 (last 10 min) × tau:
    Trigger failover.
Now, instead of using a fixed threshold, we can use the average of the latency scores in the past n minutes. This introduces a learned threshold instead of a fixed one. It is useful if we want to capture a sudden upshift in the latency. Tau can be used to give us a control over the value.
Detecting shape change in the histogram
if % of requests under 3s drops from 95% → 40%:
    Trigger failover.
Till now, we have tried looking at the percentile of request timings. But what if we focus on the distribution of request duration? i.e, instead of looking at ‘How much p75 or mean latency is shifting?’, we can ask ‘How many requests went from taking 2s to 3s or 4s?‘. If a large portion of requests move from “fast” to “slow” time ranges, we can detect a global latency shift.
Anomaly Detection Models
It is highly unlikely that there is a discussion of time series, and I don’t look for ML models that solve this. Hence, I tried to look for anomaly detection models for this use case.
We use ML models like Autoencoder, SVM, etc, to detect anomalies in time series. Though the initially mentioned problem does not require heavier ML models, we can still use these models to accurately analyze anomalous patterns in latency.
RNN-Based Detection
Recurrent Neural Networks can learn the expected temporal patterns of latency. If the observed latency deviates from the predicted pattern, the model flags an anomaly. These models struggle to maintain long-range dependencies, but are significantly faster than transformer-based ones.
Transformer Autoencoder-Based Detection
Transformer-based autoencoders learn a compressed representation of normal latency behavior. It can learn long-range dependencies better, but slower comparatively.
Conclusion
The current failover system mentioned in the blog typically detects isolated extreme delays, but global latency slowdowns show up in p50 and p75 latency, not p99. To maintain a responsive agentic system, monitoring should shift from single-call timeouts to distribution-aware metrics or learned anomaly models.